Get a voltage and current reading from L+G E470 SMETS1 smart meter

  • wizzo227's Avatar
    Level 21
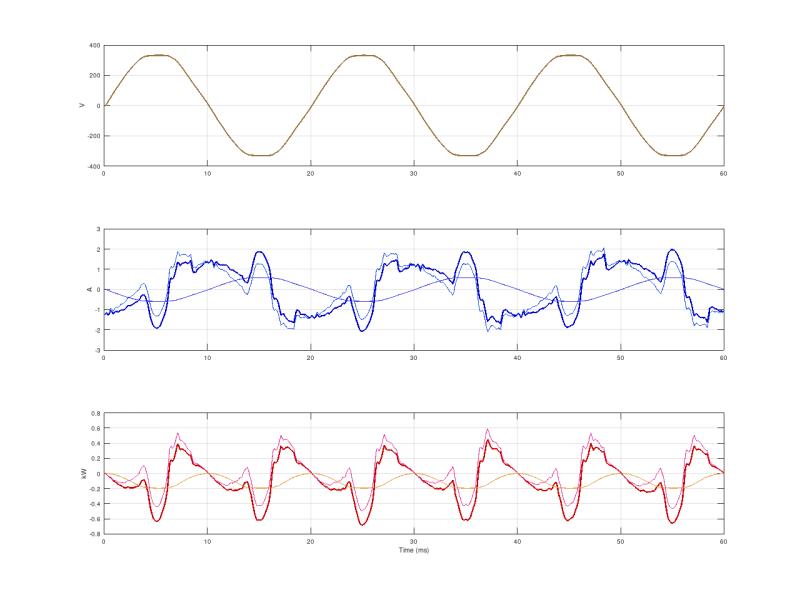
    Example UglyWave. Blue bold is the net current of the house that second, with not enough solar power in cloudy weather to cancel everything being used by a few computers, some Christmas lights, a Christmas tree .. Pointwise multiplying by the measured Voltage waveform (brown, top) gets the bold red waveform power net (up is generated or released by the house. down below 0 is used by the house). The time axis, to a few mains cycles, shows 60 milliseconds.

    I also tried computing the in phase ideal resistive current component (fine blue) and resulting power (fine orange) which at this moment was net using power. Subtracting from the bold blue the fine blue shows that most of the current at this moment was of "uglywave" shape; the other fine blue, leading to fine red "uglywave" power sloshing about in and out of the house. Blame the cheap ATX power supply as it is too big to be the Christmas tree.
    Name:  IVPwaveformExample-HouseholdNetIncludingSolarPanels-CloudyHorribleWeather.jpg
Views: 180
Size:  45.3 KB
  • retrotecchie's Avatar
    Level 92
    @wizzo227

    The four quadrant multiplier in an electricity meter works on instantaneous current and instantaneous voltage with a sample rate of around 1000 times per second, and then the resultant power, phase of current relative to voltage and differences between real power and apparent power are integrated wrt time. The waveforms have very little to do with anything, as it happens.

    Your graphs are somewhat interesting in that it tells me you are using some very cheap and nasty 'noisy' electronics. And you cannot measure anything on your electrical system if any part of your measurement system is powered from the same source.

    Electricity meters tested in laboratories, for quality control purposes or for determining meter faults are never tested directly on the mains, but on standalone isolated power supplies that use very high precision and accurately calibrated sine wave outputs in order to completely isolate them from any spikes, interference or induced coupling.

    The couple of amps you say you see 'sloshing' in and out is the VAR (VA reactive) which is perfectly normal in any electrical system. VA=VAR+W. VAR can change both magnitude and direction which is why the meter works on four quadrants, and integrates relative to time. Your graphs simply show waveform relative to time, but don't show you any integral function or phase relationship.

    And whether you are just using purely resistive loads or not (and even an immersion heater is not purely resistive) your household wiring and whatever lies between you and the substation will always have capacitance and inductance which both contribute to reactance in your electrical system.
    Don't shoot me, I'm only the piano player. I DON'T work for or on behalf of EON.Next, but am willing to try and help if I can. Not on mains gas, mobile network or mains drainage. House heated almost entirely by baby dragons.
  • wizzo227's Avatar
    Level 21
    Winter Sun

    Name:  IVPwaveformExample-HouseholdNetIncludingSolarPanels-WinterSun.jpg
Views: 182
Size:  48.4 KB
    I have no idea how a smets2 meter is meant to interpret the situation charted, and ask the relevant meter experts at EoN to comment.
    It is the same house, using the same appliances as the chart of half an hour previously in the post above. The main change was that the winter sun on the solar panels was out. The fitted ideal resistive current has flipped sign and is about +-1 Amp peak. The faint orange net ideal resistive power shows net generating. The bold blue current and bold red power charts now show mainly generating. The uglywave after substracting the ideal resistive waveform is much the same as earlier.
  • wizzo227's Avatar
    Level 21
    @wizzo227
    your household wiring and whatever lies between you and the substation will always have capacitance and inductance which both contribute to reactance in your electrical system.

    Thank you for your reply which makes sense to me if noone else. By the concrete example of the change between my 11am waveforms and 11:30 waveforms after the sun came out to generate more, please could you say what the SMETS meters which everyone has would do? I think I know what they ought to do, but I'd rather you said it than I.
  • retrotecchie's Avatar
    Level 92
    @wizzo227

    Forget the SMETS for a moment - that's irrelevant. All meters, smart or otherwise, use four quadrant multiplication and integration with respect to time. Even my 1999 model E100 L&G non-smart meter.

    Your waveforms actually indicate to me that your inverter is either one very sick puppy, or that your measurement from the CT is coupling a hell of a lot of harmonic noise into your ADC. Hopefully you will have at least a two or three stage low-pass filter with a knee frequency of about 200Hz between your CT and your ADC. If not, I suggest you fit one!

    It would be interesting to fire up a battery powered AM radio and detune it and place it next to your connection from the solar to your household wiring, and see how much the noise floor changes between having the inverter on or off.

    Not related to metering, per se, but I had a situation back this summer where I couldn't listen to TMS on Radio 4 Long Wave. I knew my very expensive and high quality tuner was fine. I contacted BBC engineering and they assured me Droitwich was running on full power.

    The problem turned out to be a cheap and nasty SMPSU on my LCD TV which was injecting harmonics of the switching frequency (50kHz) back into my mains wiring, That was re-radiating a nasty third harmonic of around 200kHz which was simply swamping R4 on 198kHz. It even radiated that harmonic through the overhead cable coming into my house from the transformer which meant I couldn't even sit in my car outside the house and listen to R4 as it was even swamping my car radio.

    So I'd also make sure you have no switched mode wall-warts or other SMPSU-powered devices generating any noise in your wiring. Again, a portable AM radio will help find a noisy PSU if you have one. If you are using a computer with a cheap and nasty ATX power supply, as you say, I'd be inclined to move everything to a laptop and only run it on battery power while you are taking your readings.

    This is why meter labs use isolated power supplies, like this one. No harmonic coupling through mains wiring.

    Name:  PS1.jpg
Views: 168
Size:  24.5 KB
    Last edited by retrotecchie; 12-12-23 at 13:18.
  • wizzo227's Avatar
    Level 21
    PS1 envy. I'm sure that my test setup is not so bad as you wrote, because when the CT probe is removed from house Neutral and put onto a specially spagettied extension lead to only a fan heater, bold blue shows a 'nice' current waveform extremely close in shape to the Voltage waveform. My point to the original poster is that with many households having many cheap power adapters and other horrible things, the current drawn typically by most houses on ordinary mains differs from that drawn by a test fan heater on a PS1. That difference, which I call "uglywave" can be all that is left when rooftop solar panels into a perfect inverter is generating about the right quantity of sinelike power.

    So to get back on track to the question from the original post, can we say:
    Y/N his SMETS meter probably has a fault and getting it checked on a PS1 is a good idea ?
    Y/N his SMETS meter is probably not doing what he expected because his house is doing what houses usually do, which differs from ideal ?
  • KeithWilliamson's Avatar
    Level 5
    Thanks everyone.
    Name:  P1060219.jpg
Views: 167
Size:  26.4 KB

    Here is a picture of the meter in the hopes that Retrotecchie can identify it.

    I am using it as a single rate meter. Although my tariff has changed recently, it is still showing the previous tariff and daily standing charge.

    I have been doing my tests at night, when the solar panels are not generating to try to avoid any confusion about waveforms and power export. So while I think I understand your thoughts, Wizzo227, I suspect your suggestion is not the answer. I usually use one or two 3kW fan heaters and/or the immersion heater to do the tests, so the load could be mostly solidly unity power factor. There is very little other non-linear load, apart from a few LED light bulbs.

    My solar panel system is a SolarEdge system, which provides a lot of data on a PC, iPad or iPhone apps. When I do the tests the inverter is saying it is idle.
  • meldrewreborn's Avatar
    Level 91
    There are times when I’m glad I don’t have a Smart meter and I don’t have solar PV. I’m a simple soul unaffected ( I hope) by all this technical stuff. But I Also hope people are conducting their tests safely - I’d hate for there to be any accidents.
    Current Eon Next and EDF customer, ex Zog and Symbio. Don't think dual fuel saves money and don't like smart meters. Chronologically Gifted. If I offend let me know by private message, but I’ll continue to express my opinions nonetheless.
  • retrotecchie's Avatar
    Level 92
    @KeithWilliamson

    L&G E470 ZCX310H Release2

    The only additional nugget of information I can provide on that model is that there are two different menu hierarchies on that model.

    If the meter has gone to sleep (blank display), then pressing and holding the A button for three seconds will bring up a different set of menus from if you press and hold the A button when the display is awake.

    Other than that, I'm afraid I have no more information.
  • retrotecchie's Avatar
    Level 92
    There are times when I’m glad I don’t have a Smart meter

    I'm glad on a permanent basis.🤣

    I have solar but it is GFB so not subject to the vagaries of SEG, FiT, or export metering. Every watt I generate I use. Plus the up front capital cost was a lot less than a grid-tied system, and will even give me power when the grid fails. I've not seen too many commercial systems supplied with the islanding feature.
    Last edited by retrotecchie; 12-12-23 at 16:39.